In essence, research is an organized and systematic way of finding answers of questions (Tabish, 2013). Organized and systematic means you’ll have a set of rules and structure when preparing and conducting your research. But the dynamic nature of a research process could send you into a long winding journey that sometimes obscures the initial structure and system you’ve set up.
This is especially true when it comes to qualitative research. Unlike quantitative research where you have clear numbers that could give measurement, qualitative have words and opinions which could be troublesome to measure. It gets harder when you have a large pool of data to deal with. That’s when structure and organized documentation are even more important.
So, whether you’re an old-timer researcher looking for inspiration, or a rookie researcher looking for a place to start, here are 2 methods that we think can help you reinforce your research structure.
1. Thematic Analysis
Thematic analysis is “a method for identifying, analyzing, and reporting patterns (themes) within data” (Braun & Clarke, 2006). It’s a qualitative approach commonly used to process text, interview or transcripts. It helps you focus on the theme and meaning across the data, which will help you see the overall picture of what’s going on.
Thematic analysis can be helpful when you deal with large numbers of qualitative data because it helps you to divide it into smaller thematic chunks which are easier to digest. It is also a good approach to use when you want to find user’ opinion or view from an interview result.
It is especially useful if you’re:
- New to qualitative research
- Wants to find pattern or trend in data
- You need a system that involves visual aids
In general, thematic analysis can be split into 3 main steps: Data Coding, Identifying Key Theme, and Data Interpretation.
- Data Coding
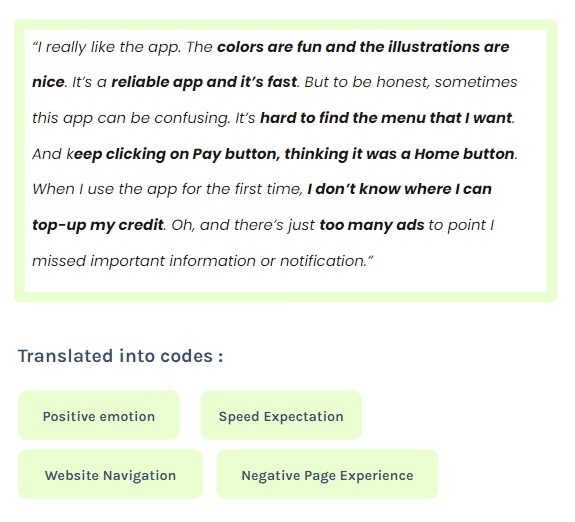
Simply put, data coding is a process of labeling or “coding” important parts of data. Whether you create a set of code beforehand or during the analysis, it’s all about assigning labels or code that represents the information that are relevant to the goal of your research. Let’s see an example of the interview snippet below and how we could assign code to some interesting information.

In the snippet above, we’ve marked some statements that are relevant to our research. Each statement corresponds to different code. For example, we code “Hard to find the menu that I want” with “Negative Page Experience”. And as we go through the whole transcript, we might add more codes if there is any information that we see relevant or interesting. Don’t forget to create a codebook so you can keep track of all the codes you’ve used.
- Identifying Key Theme
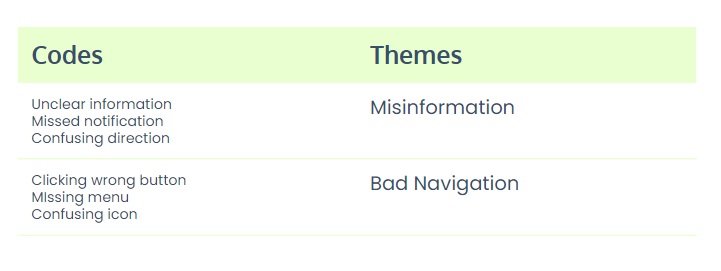
Once you’re done with coding, now it’s time to gather all the code and group them into themes. Themes are generally broader than codes but it’s a powerful way to spot trends and patterns, or to get the gist of what’s important or urgent. It’s also a way to sort your codes, to see if there are codes that are actually irrelevant at the end of the day.

- Data Interpretation
Lastly, once you have all your themes, you can start writing down your interpretation. You can also try to group them into a feasible action plan; which themes need to be prioritized and which themes could still wait on the sideline. In short, this step will depend on the type and the goals of your research.
2. Repository for Data Organization & Documentation
Your research structure will only be as strong as your documentation. Imagine going through a lengthy research process just to find yourself fumbling for important information at the end of the stage due to bad documentation. How can a repository help reinforce your research structure, you wonder?
- It gives a centralized documentation where all related parties could easily access relevant documents or even get the general view of the research. You can put all the related previous research from various projects. It will save you time, no more digging around tenth of folders just to find one research document.
- It serves as a guideline, a document that helps you get back on track in the middle of a long research process. You can relook at your goal or at all the important points that need to be addressed in your final design.
- Can act as a reliable source of information for many stakeholders and during deck-making. No more misinformation and say hello to a smooth decking process.
What to put inside the repository? Good question.
We know it’s lame, but it depends on your needs and your working culture. Who are you working with? Who will need what? What kind of problems do you want to resolve with this repository? At the end of the day, a repository should be a flexible but centralized source of information.
We’ll give you a glimpse of possible sections that you can add to your repository.
- Documentation and tools : Maybe a link to a client’s brief or previous research deck. It’s a section that includes all the documents and tools that you’ll find crucial for your research process.
- We call it the “Bear in Mind” section : It’s where you plop down all the information that could serve as your guideline. It could be a one-liner brief, project/research objective, previous insight or evidence, or even your problem statement.
- Design Checklist : It’s basically a table where you list down all the requirements that have to be met in your design with the approach you want to take based on research you’ve done.
At the end of the day, research is a dynamic process and there are tons of methods you can try out there. What we discuss here were just a few that we think could help you start your research with a proper structure and documentation; thematic analysis as a way to help you spot patterns in a more organized way and a repository that helps you as a guideline and a centralized source of information.

